
Aug 04, 2026
Sizing an IQF tunnel freezer means matching product heat removal, hourly throughput, conveyor loading, residence time, airflow, refrigeration capacity and operating schedule so the defined product reaches a defined outlet condition. It is not the act of selecting a catalog model from kilograms per hour alone. A reliable design starts with product data and ends with a measurable acceptance test.
This guide presents a practical sizing workflow for food processors and project engineers. It uses equations as screening tools, not as a replacement for detailed food-property data, validated freezing-time methods or a manufacturer’s engineering calculation. It also explains why product thickness, inlet temperature, belt arrangement, frost accumulation and shift schedule can change equipment size even when the required kg/h stays the same.
JET Technology publishes model examples across several tunnel-freezer types. Its impingement range includes reference capacities from roughly 250 to 1,500 kg/h for specified products and conditions. Its mesh-belt and solid-band page lists examples from about 300 to 1,000 kg/h with belt widths from 1,200 to 2,600 mm. These figures help buyers understand available scale, but a project must be sized around the actual food and process.
IQF tunnel freezer sizing includes the thermal duty, conveyor area, dwell time, airflow system, evaporator, refrigeration plant interface, defrost plan and operating margin required for a specific product. Each element is connected to the others.
The product defines the heat that must be removed. Warm food entering at 20°C carries more sensible heat than the same food entering at 4°C. A product with high water content requires substantial latent heat removal during freezing. A target core temperature of -18°C requires more duty than crust freezing the surface while the center remains warmer. Packaging and trays add heat and thermal resistance.
The freezing-time requirement defines how long the product must remain in the active freezing zone. Residence time and belt loading then define the conveyor area. Airflow and evaporator design must deliver heat transfer across the full belt width while the refrigeration system absorbs the product load and equipment loads. Frost changes that performance over time, so the design must remain acceptable at the end of the required production campaign, not only immediately after defrost.
Sizing also includes commercial and site constraints. The freezer may need to fit between existing machines, under a ceiling, beside columns or within a limited maintenance envelope. A wider, shorter tunnel and a narrower, longer tunnel may provide similar belt area but create different airflow, transfer, cleaning and building impacts. The best design is an optimization rather than a single mathematical answer.
Before calculating, define what “IQF” means for the product. For peas, it may mean separate free-flowing pieces with limited clumping. For patties, it may mean individually handled pieces that retain shape. For packaged meals, individual separation may not be relevant even though the equipment is sold within the IQF category. Acceptance criteria should reflect the commercial product, not only the equipment label.
The first sizing step is to define the product and outlet condition with enough detail to calculate heat load and freezing time. The product name is not sufficient because thickness, composition and temperature can vary widely within one category.
Create a product data sheet with minimum, normal and maximum values. Record piece length, width, thickness, weight and tolerances. For irregular products, include a size distribution and identify the thickest regular piece. The largest occasional defect should be handled by quality control rather than forcing the freezer to be oversized, but the normal high-end thickness must be part of the design.
Record raw, cooked, par-cooked or blanched status. Cooking changes inlet temperature, moisture distribution and surface condition. A breaded chicken portion arriving directly from frying may carry surface oil and heat that differ substantially from a pre-chilled raw portion. A warm product can also release more moisture into the freezer, increasing frost load.
Define inlet temperature as a range. Use measured plant data across shifts and seasons. If the product normally enters at 5°C but can reach 12°C during a summer peak, the design and operating procedure need to address that event. It may be more economical to control upstream chilling than to size the freezer for an avoidable temperature excursion.
Define the outlet condition precisely. Common requirements include maximum core temperature, average core temperature, percentage of samples below a limit, surface temperature, crust depth, firmness for slicing, free-flowing separation, or readiness for packaging. The FDA recommends 0°F (-18°C) for freezer storage, but an industrial tunnel often uses much colder air to drive heat transfer. Air temperature, surface temperature and core temperature must not be confused.
List quality constraints. These may include maximum weight loss, dehydration, shape deformation, cracking, coating loss, belt marking, clumping, color change and temperature spread. A design that reaches temperature but damages presentation is not successful.
For each product, collect specific heat or enthalpy data when available. Food properties change through the freezing range, so a constant specific-heat calculation is only a rough screen. Manufacturers may use food-property databases, measured composition or validated software. If data is uncertain, product trials become more important.
Product heat load is the rate at which heat must be removed from the incoming food to reach the required outlet condition. It is usually the largest process load in an IQF freezer and should be calculated from enthalpy difference whenever reliable data is available.
A useful screening equation is:
Product refrigeration duty = mass flow × (inlet enthalpy − outlet enthalpy)
If mass flow is in kg/s and enthalpy difference is in kJ/kg, the result is kW. For example, 1,000 kg/h equals approximately 0.278 kg/s. If the estimated enthalpy removal is 300 kJ/kg, the product load is about 83 kW. This is an illustrative calculation only; the correct enthalpy difference depends on composition and temperature.
The total evaporator load is higher than the product load. Add heat from conveyor and fan motors inside the cold space, enclosure transmission, infiltration through openings, warm air carried by product and packaging, lighting, defrost recovery and any people or cleaning water during relevant conditions. Fan power can be significant in high-air-velocity equipment because most motor energy eventually becomes heat that the refrigeration system must remove.
A preliminary margin may cover data uncertainty and operating variation, but excessive margin can increase capital cost, compressor cycling and inefficient operation. Separate a quantified uncertainty from an arbitrary safety factor. If the largest uncertainty is inlet temperature, measure it. If it is product moisture or thickness, sample it. Better data is often cheaper than oversized equipment.
ASHRAE has published a broad order-of-magnitude estimate of around 40 tons of refrigeration per ton of product per hour for IQF systems. Converted conceptually, this is a substantial load and confirms why quick freezing requires serious refrigeration capacity. It is not a model-selection rule. Use it only as an early reasonableness check because the actual duty changes with product enthalpy, fan heat, temperature, airflow and efficiency.
The refrigeration design should also consider peak versus average load. When warm product starts entering after defrost, the evaporator and compressor system may see a rapid increase. During stable operation, frost may gradually reduce heat transfer and airflow. The plant needs enough capacity and control range across the campaign rather than at one calculation point.
The refrigeration system interface should state refrigerant, evaporating condition, feed method, defrost method, available capacity, control valve scope, oil-management responsibility and suction/discharge constraints. A freezer cannot meet its design if the connected plant supplies a different condition from the calculation.
Freezing time is the period required for the product to reach the defined thermal condition under stated heat-transfer conditions, while residence time is the period the conveyor keeps the product inside the effective freezing zone. The required residence time must be at least the validated freezing time plus any operational allowance justified by variation.
Food freezing is not governed by air temperature alone. Important variables include initial and final temperature, thickness, shape, density, water content, packaging, surface heat-transfer coefficient and airflow. FAO technical guidance emphasizes these factors and notes that, under high surface heat-transfer conditions, freezing time can be strongly related to the square of product thickness. This explains why a small increase in thickness can require a much longer tunnel or slower belt.
FAO also provides an illustrative fish example: a 150 mm tuna in an air-blast freezer may take about seven hours to freeze when entering at 35°C, compared with about five hours when entering at 5°C. The exact numbers are product-specific, but the lesson is general. Upstream temperature control can materially reduce freezing time and equipment duty.
For regular shapes, engineering methods based on Plank-type equations or more advanced correlations can estimate freezing time. Irregular foods, phase-dependent properties, packaging and complex airflow reduce accuracy. Computational models can support design, but they still need input data and validation. A representative product trial remains the strongest evidence when the product is new or quality requirements are tight.
Convert the selected freezing time into conveyor residence time. For a straight tunnel:
Residence time = effective freezing length ÷ belt speed
If the effective freezing length is 18 m and belt speed is 0.10 m/min, residence time is 180 minutes. If speed doubles, residence time halves, but capacity does not automatically double because belt loading, airflow and refrigeration may become limiting.
“Effective freezing length” must be defined. Infeed vestibules, discharge transitions, service gaps and areas with weak airflow may not contribute equally. Ask the manufacturer to mark active zones on the layout and state the speed range for each recipe.
Use the thickest regular product and maximum normal inlet temperature for the critical condition. For mixed products, build a recipe matrix. If one slow-freezing product would require a much larger tunnel but represents little volume, consider upstream pre-cooling, a separate batch process or a different freezer rather than compromising the main line.
Belt loading is the amount and arrangement of product carried per unit conveyor area, and it connects hourly throughput to belt width, speed and residence time. It must preserve airflow exposure, product separation and stable transfers.
For discrete pieces, begin with pieces per minute:
Pieces per minute = required kg/h ÷ piece weight in kg ÷ 60
A 1,000 kg/h line processing 0.10 kg patties requires about 167 patties per minute. If the belt holds 10 patties per row, about 16.7 rows per minute must enter. A row pitch of 0.20 m then requires approximately 3.34 m/min belt speed. This simple example shows how product arrangement can drive speed before thermal performance is considered.
Next determine required lane width. Add product width, lateral spacing, edge clearance and guide allowance. Belt nominal width is not always usable width. Air ducts, side structures and edge effects can reduce the effective loading area. Ask for usable loading width and the validated temperature performance at outer lanes.
For irregular or bulk products, use kilograms per square meter and bed depth. Dense loading increases capacity per meter but can reduce airflow and individual separation. A mesh belt permits air passage but may mark soft food. A solid belt supports wet or sticky products and prevents drip-through but changes bottom-side heat transfer. The belt selection must be included in the freezing-time basis.
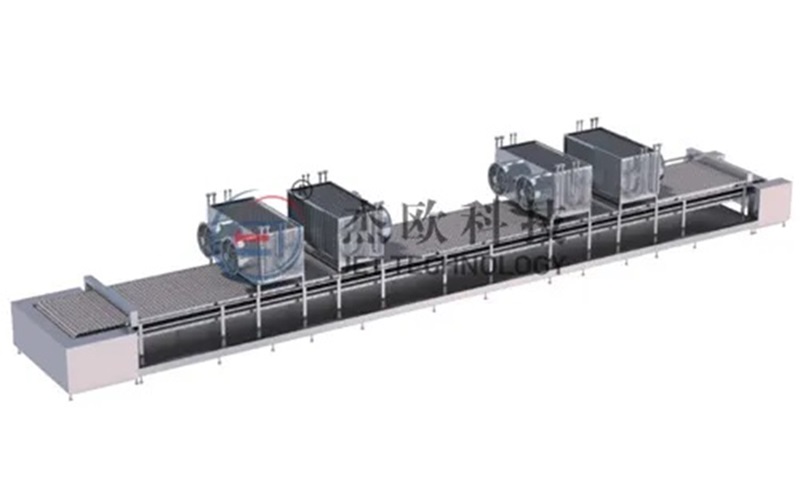
The mesh belt tunnel freezer and solid-band configuration should therefore be evaluated with actual release, marking, airflow and sanitation needs. JET’s published model examples include belt widths from about 1,200 to 2,600 mm and nominal capacities from 300 to 1,000 kg/h for stated reference conditions. A wider belt may reduce tunnel length, but it requires uniform airflow and may increase building width and cleaning reach.
Calculate active conveyor area as:
Active belt area = usable belt width × effective freezing length
For products loaded at a defined kg/m² and moving through in a defined residence time:
Hourly capacity = active belt area × belt loading ÷ residence time in hours
Suppose usable width is 1.5 m, effective length is 20 m, loading is 12 kg/m² and residence time is 0.5 hour. The screening capacity is 720 kg/h. This does not prove thermal capacity; it only shows the conveyor area can physically carry that mass at the specified loading. The heat-transfer and refrigeration calculations must confirm it.
Check infeed and discharge. The upstream machine must present products at the calculated pattern. If pieces arrive in surges or overlap, average capacity may be adequate while local loading becomes excessive. Accumulation, metering, lane alignment and reject handling should be part of the line design.
Airflow and tunnel technology selection determines how refrigerated air contacts the product and whether the line can meet heat-transfer, separation and quality requirements. The same belt area can perform differently under impingement, crossflow or fluidized conditions.
Impingement directs concentrated jets at product surfaces and is attractive for thin, flat foods. It can shorten surface-freezing time and support crust freezing, but thickness, light toppings and wet surfaces must be evaluated. For an impingement tunnel freezer, nozzle pressure distribution, nozzle-to-product distance, top-and-bottom access and belt openness are key design inputs.
Crossflow or multi-directional tunnel airflow serves a broad range of seafood, poultry, bakery and prepared foods. It can use mesh or solid belts and may be easier to adapt to varied products. The design must prevent dense loading from creating sheltered regions. Adjustable fan speed can help delicate products, but validation is needed across the range.
Fluidized-bed systems are used for small pieces that should remain separate. Upward airflow and mechanical action mobilize the product bed. Product surface water, size distribution, stickiness and feed uniformity strongly affect performance. A product that is too large, fragile or sticky may not fluidize well.
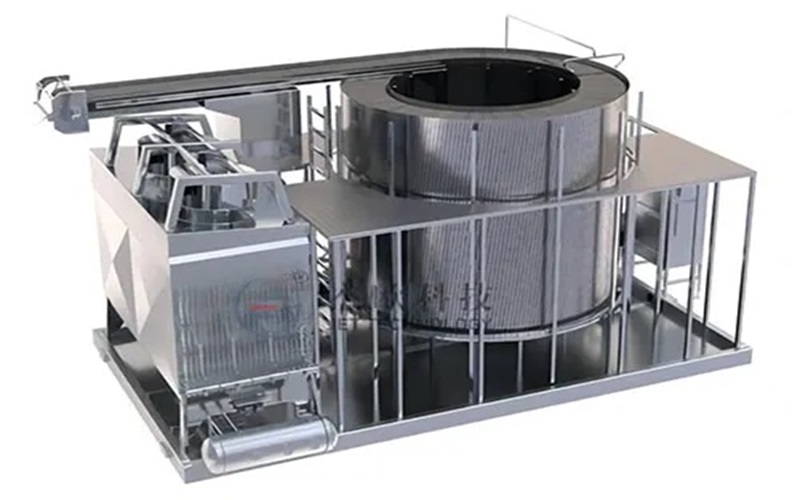
Plate freezing uses conductive contact and is generally sized differently. It is appropriate for blocks, cartons or packages with regular surfaces. Spiral freezing uses a long belt path arranged vertically and can provide long residence time in a smaller floor footprint. If the straight-tunnel calculation produces an impractical length, comparing a spiral is sensible.
Do not select technology based on the word “IQF” alone. Define the commercial result: separate pieces, fast crust, complete core freezing, limited weight loss, compact footprint, long campaign, easy product changeover or low sanitation labor. Rank these requirements and test the selected mechanism against them.
Air velocity has diminishing returns and energy consequences. Higher velocity can improve surface heat transfer, but fan power rises and delicate products may move or dry. The optimum is product-specific. Ask for fan-control range and performance evidence rather than assuming maximum speed should be used continuously.
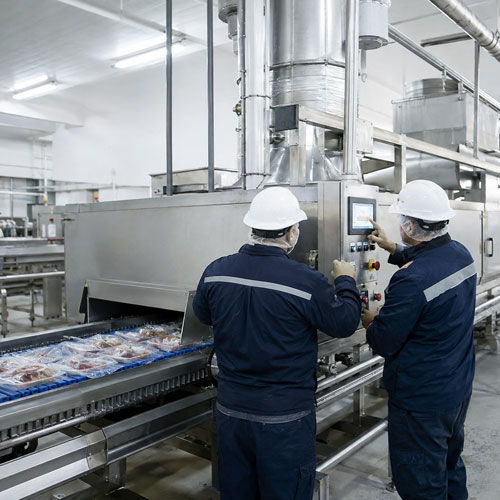
Frost and defrost sizing accounts for performance loss caused by moisture freezing on the evaporator and for the production time required to restore the system. A freezer sized only for clean-coil conditions may fail late in the shift.
Moisture enters with the product, surface water, packaging, open infeed and discharge, humid plant air and sanitation residue. As frost builds, it can reduce air passage and insulate heat-transfer surfaces. Fan pressure and power may change. The outlet product temperature can gradually rise even when setpoints remain unchanged.
Define the required campaign length: hours from stable startup to planned defrost or sanitation. A plant needing 20 continuous hours may require larger evaporator face area, wider fin spacing, sequential defrost or lower moisture ingress than a plant that stops every eight hours. Ask the manufacturer for end-of-run performance assumptions.
Defrost methods can include hot gas, water, air or scheduled warming depending on the system. Each method affects refrigeration controls, water use, drain design, energy, sanitation and restart time. The evaporator and freezer supplier must agree on sequence and safety interlocks.
Include startup and recovery in the production plan. After defrost or sanitation, the tunnel needs to drain, dry where required, cool down and stabilize. Product should not enter until temperature and airflow are ready. If a nominal eight-hour shift includes one hour of cooldown and cleaning-related recovery, the available production time is lower than the calendar shift.
Calculate required nominal capacity from net production time:
Required operating capacity = daily production target ÷ actual freezing hours
If the plant needs 16,000 kg/day and has only 14 effective freezing hours after changeovers, sanitation and recovery, the line must average about 1,143 kg/h, not 1,000 kg/h. Add realistic micro-stoppages and line efficiency rather than assuming 100% utilization.
Consider redundancy for critical plants. Two smaller tunnels can provide product flexibility and partial operation during maintenance, while one large tunnel may have lower capital cost and simpler line flow. The correct choice depends on product portfolio, downtime cost, building space and refrigeration architecture.
Worked sizing scenarios show how the same hourly mass can lead to different equipment because product temperature, thickness, loading and freezing mechanism change the thermal and conveyor requirements. The figures below are illustrative screening examples, not JET guarantees.
| Scenario | Product and duty | Critical sizing driver | Likely technology direction | Engineering data still required |
|---|---|---|---|---|
| A | 1,000 kg/h chilled hamburger patties, 100 g each, entering at 4°C, complete freeze | High piece count, thin geometry, row pattern, shape stability and uniform top/bottom exposure | Impingement tunnel may be attractive | Diameter, thickness, formulation, target core, allowable deformation, belt pattern, run hours |
| B | 1,000 kg/h warm dumplings entering near 20°C | Higher product heat load, wrapper moisture, belt release and possible marking | Impingement or belt tunnel after product test | Piece geometry, filling temperature, surface moisture, target core, belt type and upstream cooling |
| C | 1,000 kg/h peas or diced vegetables | Individual separation, surface water, bed depth and fluidization behavior | Fluidized-bed IQF freezer | Size distribution, blanching/cooling condition, dewatering, stickiness and feed uniformity |
| D | 1,000 kg/h packaged fish blocks | Package thickness, contact area and long internal conduction path | Plate freezer or air blast depending on package and handling | Block dimensions, packaging, loading automation, inlet and target temperature |
| E | 1,000 kg/h mixed bakery products with long dwell time and limited floor space | Product variety, gentle handling, long residence time and footprint | Spiral freezer or flexible belt tunnel | Recipe matrix, toppings, trays, transfer heights, sanitation and available building height |
Consider Scenario A. At 100 g per patty, the line handles 10,000 patties per hour. If the belt loads 12 patties per row, approximately 833 rows per hour enter, or 13.9 rows per minute. With 180 mm row pitch, the belt speed is about 2.5 m/min. If the validated freezing time is 20 minutes, the effective belt path would need about 50 m, which may indicate multiple passes, a wider loading pattern, faster heat transfer, lower inlet temperature or a different layout. This calculation reveals questions early.
Scenario B has the same mass flow but warmer product. If the enthalpy difference is materially higher, the refrigeration system and evaporator must remove more heat. The product may also release more moisture, increasing frost. Upstream pre-cooling could reduce tunnel length, power and defrost burden. The economic comparison should include the cost of that pre-cooling step.
Scenario C is controlled by separation rather than flat-surface heat transfer. A conventional solid belt with dense loading could produce clumps even if temperature is achieved. Fluidization may expose individual pieces more uniformly. However, excess surface water can create ice bonding, so dewatering is part of freezer performance.
Scenario D shows why kilograms per hour cannot choose the machine. Thick regular packages may freeze efficiently between plates, while a long air tunnel could use more floor area and fan energy. Scenario E may favor a spiral because the belt length required for varied bakery products is too long for the available room.
Commissioning and validation confirm that the sized freezer performs with the real product, real refrigeration plant and real operating team. Calculations become useful only when connected to measured results.
Begin with instrument calibration. Product probes, air sensors, belt-speed measurement, pressure instruments, electrical meters and refrigeration data should have known accuracy. Define probe insertion method and location. For small pieces, the probe itself can disturb the sample, so use an agreed method and sufficient sample count.
Condition the product within the design inlet range. Record product dimensions and loading. Run the freezer until air, belt and refrigeration conditions are stable. Then sample across the belt width and over time. Include outer lanes and the end of the production campaign, when frost may be greatest.
Record throughput from measured mass over time, not only conveyor speed. Record rejected or lost product separately. Measure outlet core or surface condition according to the acceptance definition. If weight loss is important, use matched samples and a controlled weighing procedure.
Compare measured performance with the sizing basis. If warm lanes appear, investigate airflow distribution, loading and nozzle or belt condition. If all products are warm, examine inlet temperature, residence time, refrigeration condition, frost and thermal calculation. If capacity is met only at an impractically low load density, the infeed arrangement may need redesign.
Validate each commercial recipe, not only the easiest product. Define the approved operating window for belt speed, fan speed, temperature and loading. Lock or control settings so operators cannot unknowingly exceed the validated range.
Conduct sanitation validation as part of commissioning. Time disassembly and cleaning. Inspect hard-to-reach areas. Verify drainage and safe restart. A freezer that meets thermal performance but cannot be cleaned within the production schedule is undersized operationally because sanitation reduces available hours.
After startup, trend key data. Gradual changes in outlet temperature, fan power, pressure, defrost frequency or belt tracking can indicate maintenance needs. Use the first months to refine preventive maintenance and product recipes. JET Technology should support this handover with drawings, manuals, training, remote diagnostics and agreed site service.
Frequently asked questions about IQF tunnel freezer sizing address capacity, temperature, belt width, refrigeration load, margins and product testing.
No. Kilograms per hour must be paired with product dimensions, composition, inlet temperature, target outlet condition, belt loading, freezing time, operating hours and quality requirements. The same kg/h can require very different machines.
Thickness is often the most influential dimension because heat must travel from the center to the surface. Use the thickest regular product and its tolerance, not only average weight. Shape and packaging also affect freezing time.
For a straight tunnel, divide effective freezing length by belt speed. The result must meet or exceed validated freezing time under the design product and airflow conditions. External enclosure length may be longer than active freezing length.
Calculate product enthalpy load and add fan, conveyor, transmission, infiltration, frost and defrost-recovery loads. Broad rules of thumb are only early checks. Final capacity requires product data and the actual refrigerant design condition.
Add a documented margin for measured variation and calculation uncertainty, not an arbitrary oversized factor. Oversizing can raise capital cost and reduce control efficiency. Improve the data first, then apply a rational margin.
A product test is especially valuable for new formulations, irregular geometry, delicate coatings, uncertain separation, tight weight-loss limits or unusual packaging. Use representative product, loading, inlet temperature and a written measurement plan.
Correct IQF tunnel freezer sizing begins with a defined product and outlet condition. The engineer estimates heat load, validates freezing time, calculates belt loading and residence time, selects the airflow mechanism, confirms refrigeration capacity, accounts for frost and defrost, and converts the result into an operating schedule and acceptance protocol.
The most common sizing error is to treat catalog kg/h as a property of the machine rather than a result produced under specific conditions. Product thickness, inlet temperature, belt presentation and campaign length can change the answer significantly. JET Technology can use the workflow in this guide to compare impingement, belt, fluidized, spiral and plate systems, then provide a project-specific proposal supported by assumptions and testable criteria.
This is the first one.

 English
 français
 Deutsch
 Español
 русский
 العربية


